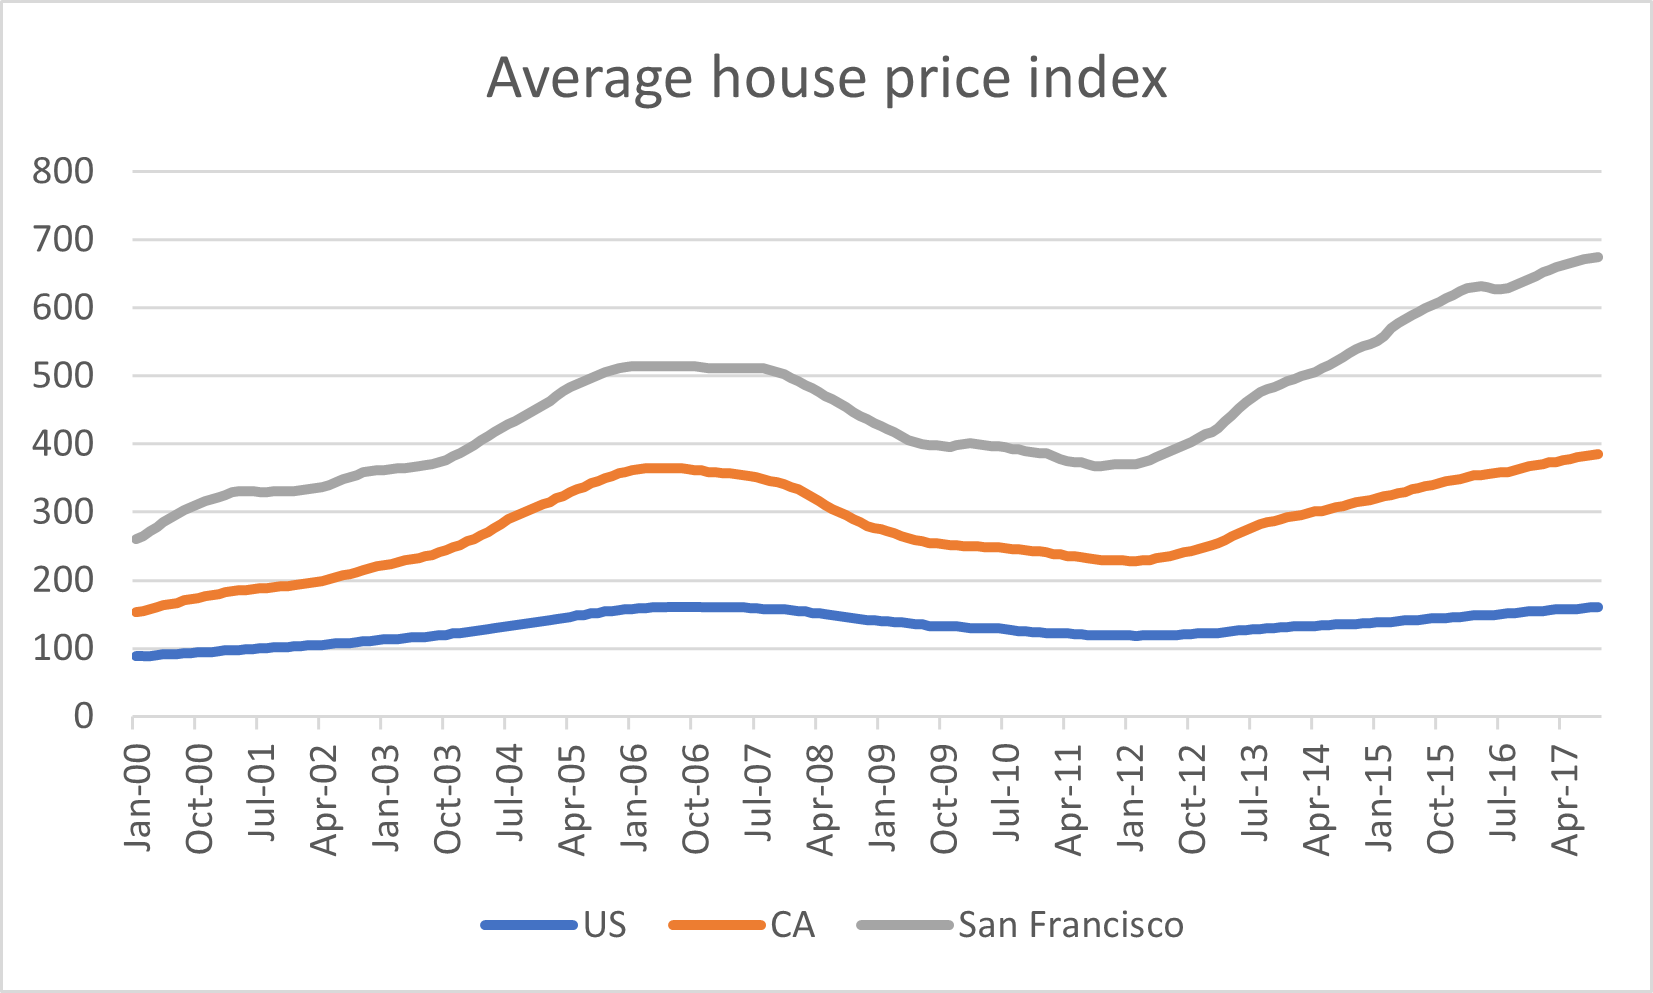
Average house price index in US, 2000-2017
This explores the overview of house price in US and with California highlighted on the map we focus on how California compares to other regions . The average House price index of US, California and San Francisco over time is also displayed as a line graph. You can choose time points by slider . Click on a state to see its details, click on a blank space on the map to deselect your state.
Legend (Average price index)
50-
100
150
200
250
300
350+